Kelly Black
Department of Mathematics
Clarkson University
Introduction
This year's Challenge consisted of three questions about the costs of obtaining an undergraduate degree, in a Science, Technology, Engineering, or Mathematics (STEM) field versus a non-STEM field, and for quantification of quality of life issues. The questions ranged from calculating the cost of a degree, comparing the long term costs including loans with the benefits, and providing a tool to help students and parents decide which degree program, if any, to pursue. This is a topic of immense importance as the cost of obtaining a college education has increased at a rate faster than inflation.
This year's Challenge was more difficult than we (the judges) anticipated. Due to the difficulty of the problem, I believe that no team provided a complete model, discussion, and analysis for all three questions. This forced the judges to consider what the students were capable of doing in the short time available to them and the different ways teams chose to allocate their time.
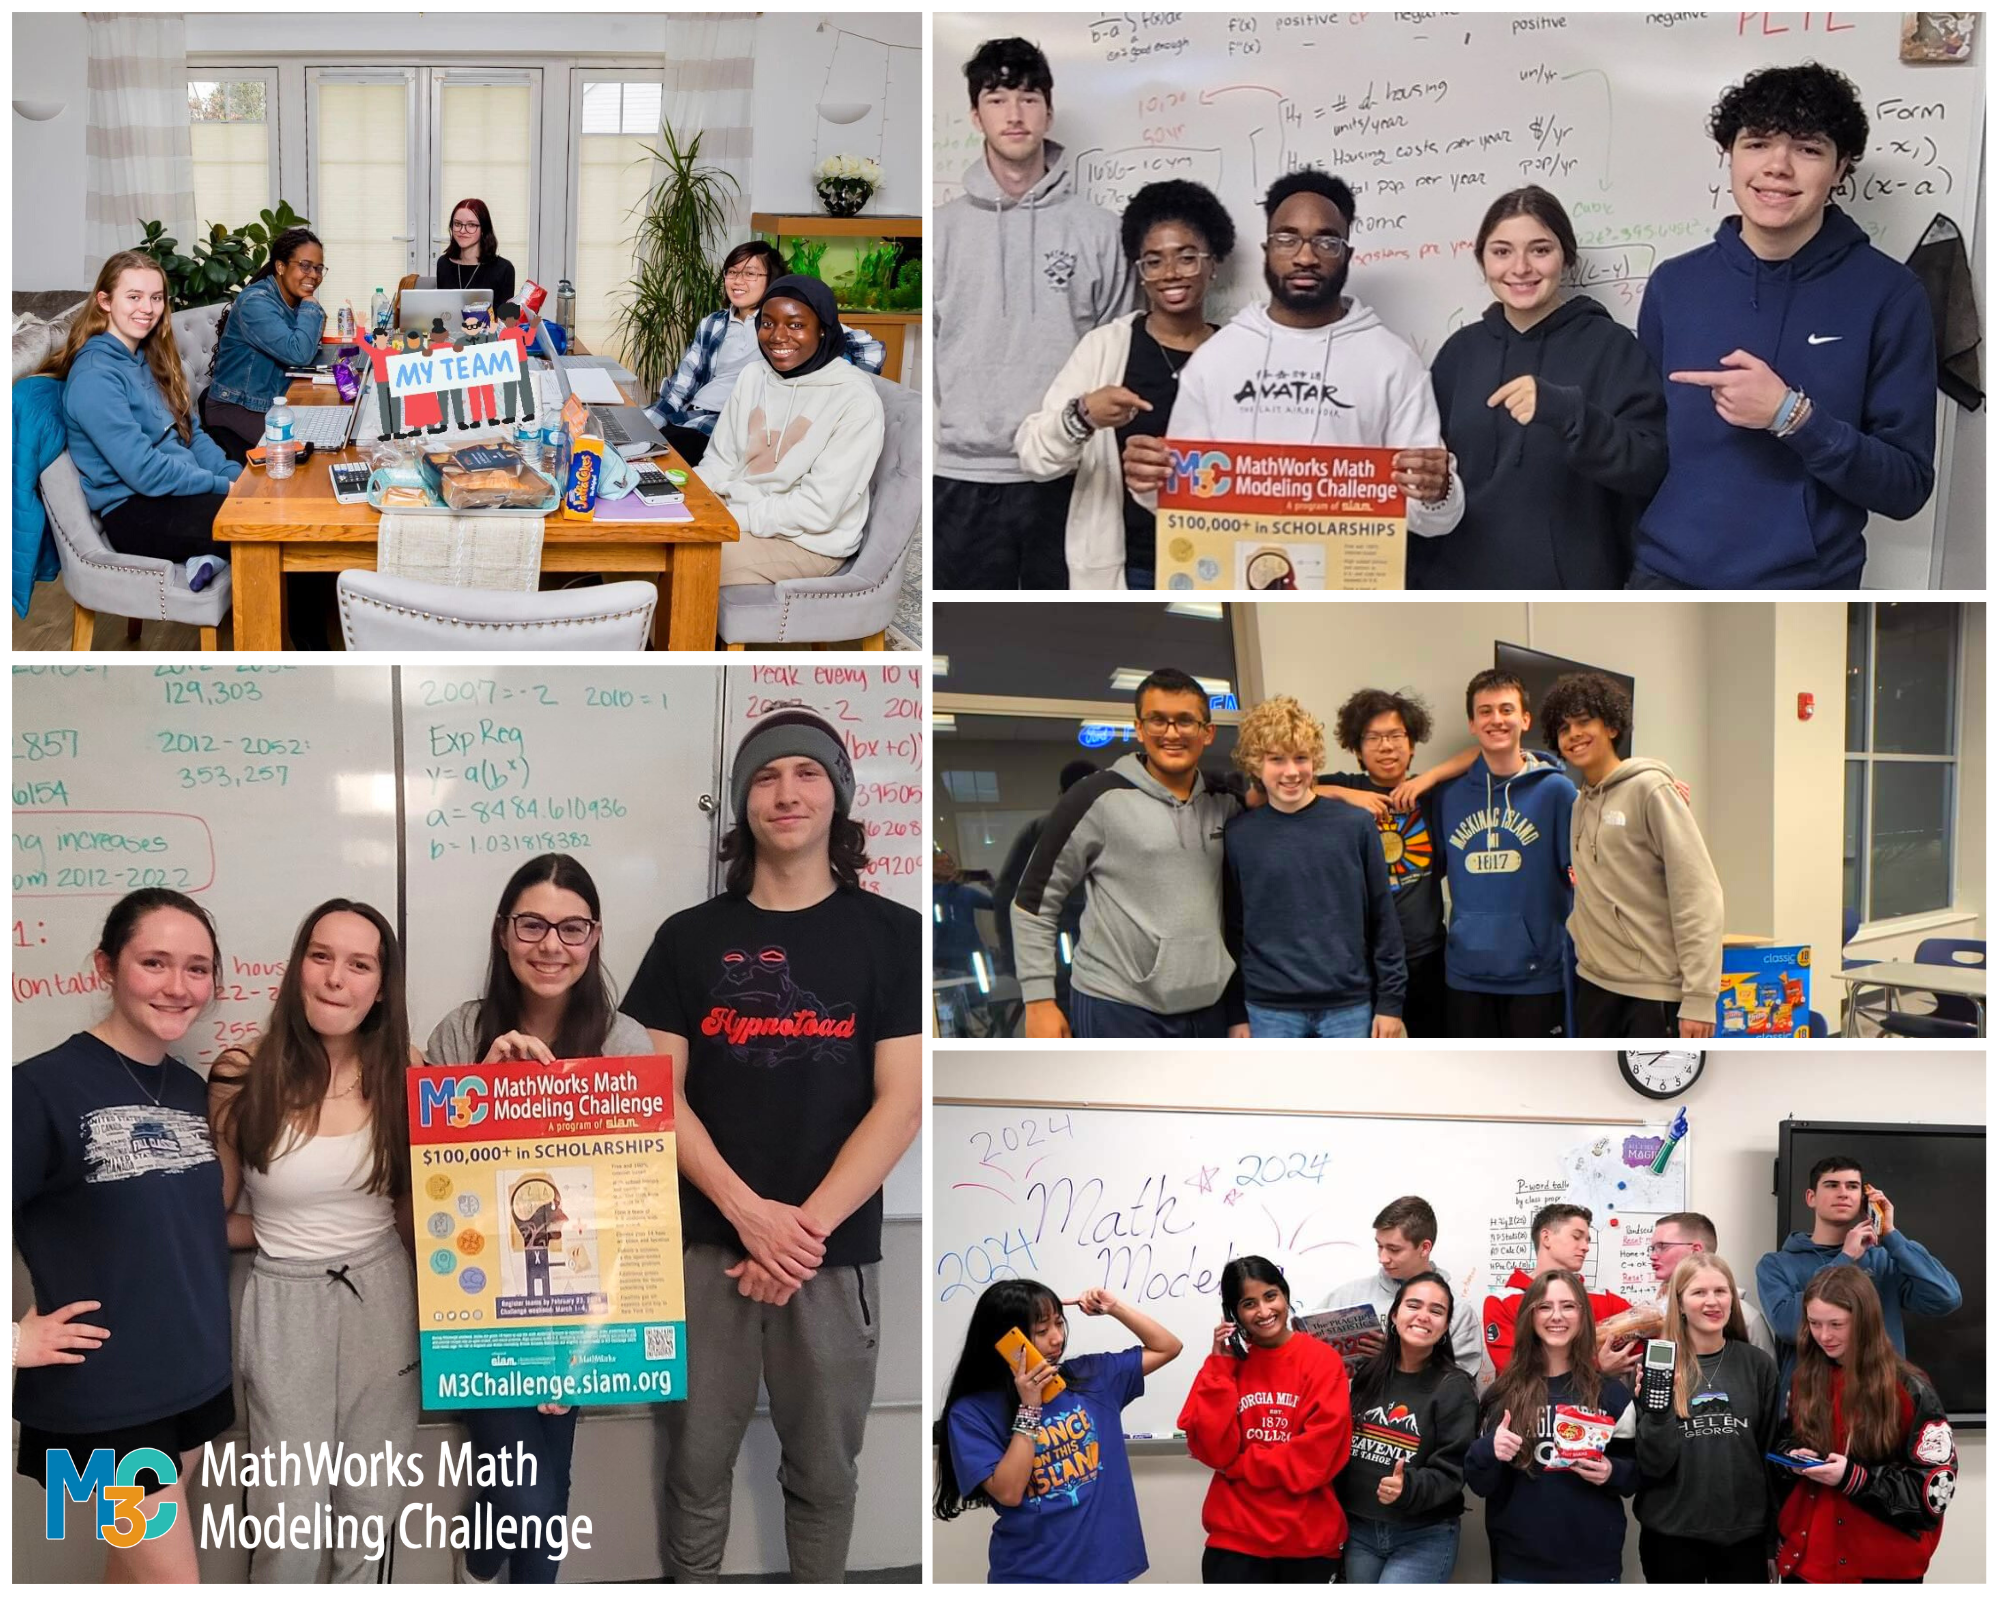
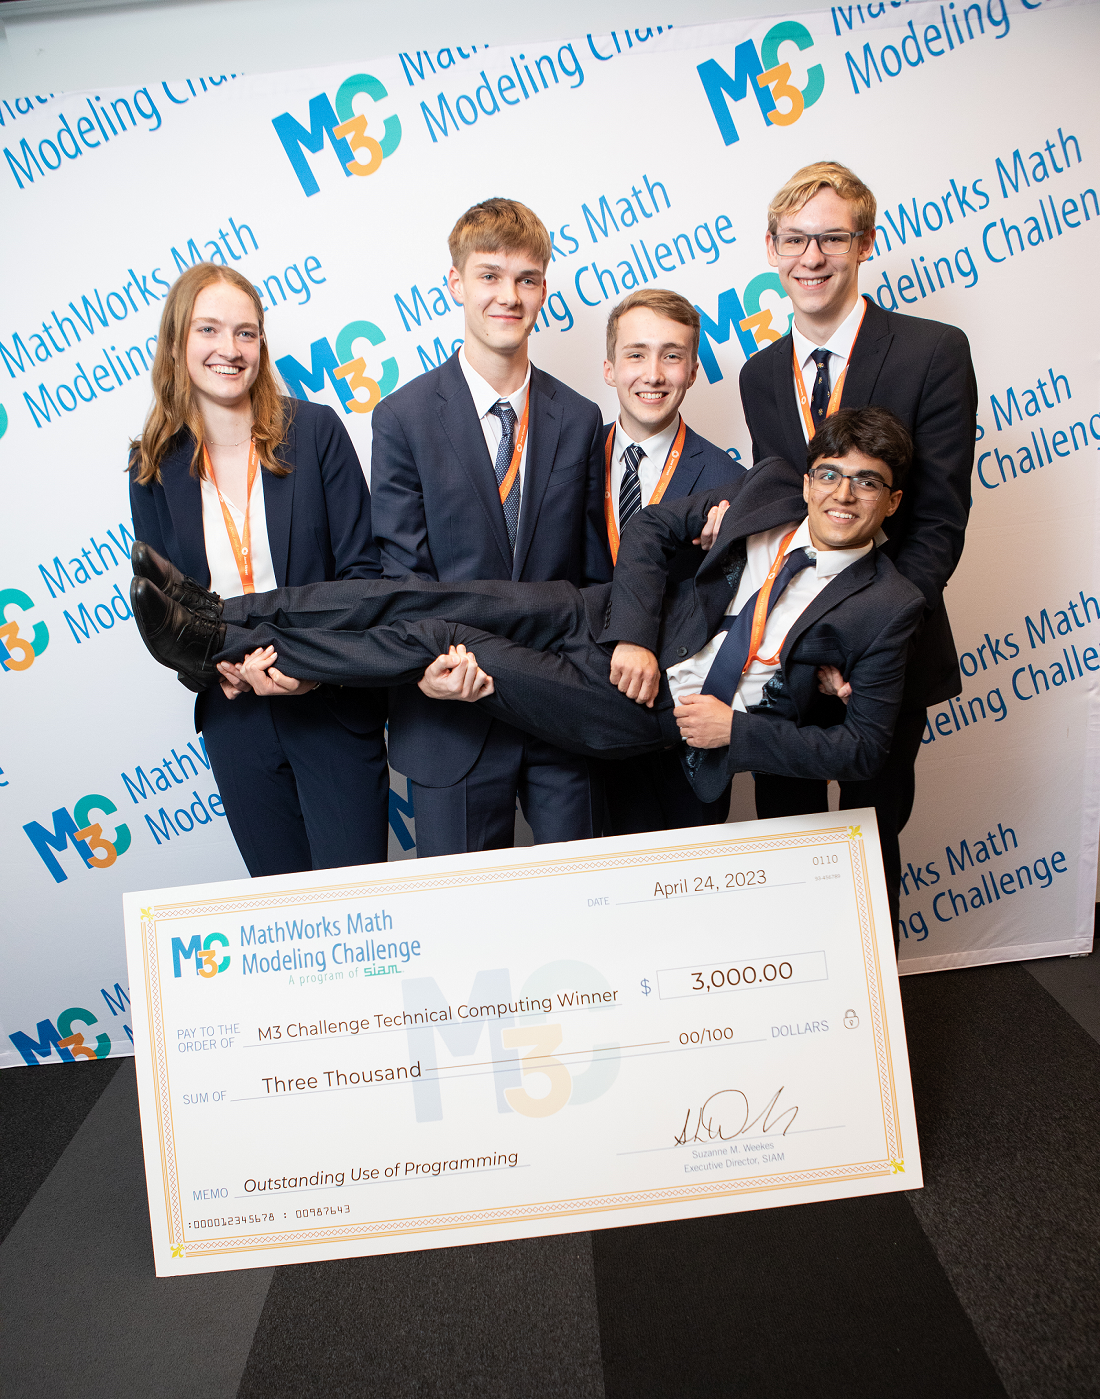
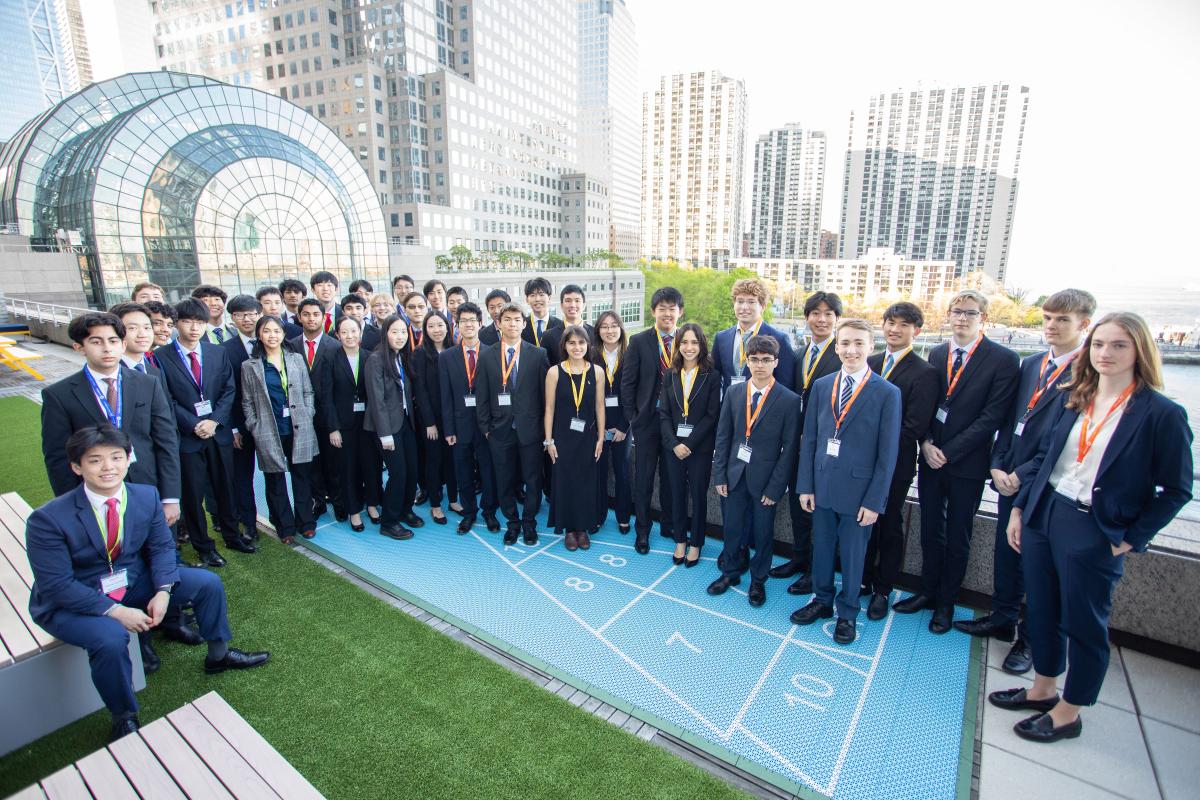
Despite the difficulty of tackling such a big problem in a short period of time, the vast majority of teams did a superb job and submitted impressive papers. The outstanding support and encouragement that many teams receive from their coaches is apparent, and once again we are grateful for their efforts. This event represents a rare opportunity for students to work as part of a team to develop and analyze models for open-ended problems. The event has continued to grow, and the entries continue to improve.
A number of observations are given here that are focused on this year's event. First, an overview of important modeling considerations is given, which was more important this year due to the difficulty of the questions. Next, issues associated with the first question are examined. After looking at the first question, some basic issues about how to express a model are given. Finally, a few specific issues that arose in many team's papers is discussed.
2 General Modeling Considerations
Some general issues with respect to technical writing were seen. The issues discussed here are the role of units in developing a model, how to define variables, the importance of using both citations and references, and the modeling process itself.
2.A Units
If there is a question about a formula or expression one of the first things a reader should do is check to see if the units are correct. This is a dimensional analysis of an expression. The units on the left side of an equation should match the right side, and the terms that are being added or subtracted should also have the same units.
This year many of the individual parts of a model were readily available through a variety of sources, and many teams simply reiterated the equations. This is a good thing to do since it is best to try to build on the good work of other people. The problem that arises, though, is trying to put together different parts of models that are assembled from different sources.
The first thing that many of the judges did this year was to simply check to make sure that the units on the resulting expressions were consistent. The importance of this issue was magnified this year in that there were essentially only a couple different units, time and money. It was relatively easy to check to see if an expression made sense by quickly checking the units. Many well written papers came under increased scrutiny after a simple check of the units in a couple expressions.
2.B Variables and Results
Another issue that comes up each year is the problem of trying to determine the meaning of a symbol, variable, or parameter. This is related to the previous topic. When checking the units within an expression it is important to be able to determine the meaning and the units associated with a symbol.
The models developed in this year's event were relatively straight forward, but they did require many parameters. Many teams simply made use of the parameters without formally defining them. This made it difficult to perform the most basic analysis on the resulting equations, and it was sometimes a challenge to read papers that made use of unfamiliar references.
Another issue is that there were some important intermediate calculations that were required for many of the models and it’s important to include these. For example the Expected Family Contribution and the Cost of Attendance were two important ideas that are used to estimate the amount of money that a family will have to pay. It was not uncommon for a team to use these ideas but not define them. It was left to the reader to try to understand how the team interpreted these important ideas.
We understand that the teams are under immense pressure to perform a large number of tasks in a short time. However, it is vital that the teams describe what each expression means as well as describe the individual entries in an expression. Something as simple as providing a table that lists each symbol and variable, along with a quick definition, can help make a team's paper more coherent.
2.C Citations versus References
Over the past several years teams have improved with respect to providing both citations and references. This year, however, it appeared that there were more teams that did not make use of citations within their report. A team that provides consistent citations and proper references will make a positive impression on the person who is reading the report. It lets the reader know that the people who wrote the report were careful in how they assembled the necessary materials and showed respect to the people whose work they shared. .
Citations are the marks within the narrative that indicate which reference was used for an important idea. References are the list of sources that can be found in either a footnote or a bibliography. We do not have a requirement for what format a team uses. Each team should make use of both citations and references and do so in a consistent manner.
2.D The Modeling Process
The process of modeling includes a large number of activities that range from describing the physical system, the development of expressions to mimic certain behaviors, and the analysis of the model itself. It is vital to understand modeling as a process. One vital component to the process is to iterate through all of the activities as a way to continue to refine and explore the model and its implications. It is difficult to explore this important aspect of the modeling process because of the time constraints associated with the Challenge.
The teams seemed to require more time to address the questions in this year's event compared to previous years. Very few teams explored or even mentioned the role of iteration through the modeling process. A small number of teams mentioned this part of the modeling process and some provided a few details about their assessments and how they would improve their models given more time. To be able to convey an understanding about the role of iteration is a good thing and will let the judges know that the students know it is important even if there is not time to refine and repeat an analysis on a model.
3 The First Question
Another thing that was different in this year's event is that a large number of teams made excellent progress on the first problem, but very few teams were able to provide a complete analysis of either the second or third questions. In this section the responses to the first question are examined. In particular, we first discuss how many teams constructed an intricate model for the first problem. Next, the role of the Expected Family Contribution is briefly discussed. The question about how long it takes to complete a college education is discussed. Finally, a brief note about the cost of living is given.
3.A Complicating the Question
In the previous two years the event consisted of three questions. Usually the first question is straight forward and allows most teams to make some progress on the problem. The second and third questions can be more difficult and generally offer a team the opportunity to stand apart from the others.
This year's first question required teams to estimate the cost of attending a college or university. Unfortunately, a large number of teams expended an unnecessary amount of effort addressing the first question given that it has already been addressed by a variety of other people, and a number of calculators are available on the web.
A large number of teams went further, though, and examined this problem in great detail. These teams often constructed complicated models that could be difficult to read and difficult to understand. We do not know if the teams thought we were looking for something more complicated or were just trying to construct a model that might stand out from the others. The unfortunate side effect was that many teams lacked the time and resources to examine the remaining questions. In fact, I did not see a team that provided a complete answer to all three questions even though a vast majority was able to provide a detailed exploration for the first question.
Expected Family Contribution
One of the more important aspects of the model associated with the first question is the meaning of the Expected Family Contribution (EFC). The EFC is a value that is used to help determine the complete financial aid package that might be available to a student. It has an impact in obtaining some scholarships as well as loans.
Teams interpreted the meaning of the EFC in a wide variety of ways and few teams completely described the EFC. This made it difficult for the judges to reliably make assumptions about the way a team interpreted the EFC which made it difficult to read some papers.
Papers that included a description of the EFC were generally much easier to read and understand. Even if a team did not have a correct interpretation, it made it easier for a judge to determine if their model and the calculation of the EFC were consistent. It is more important to construct the model in a consistent way with the various calculations than to have everything be perfect in the first iteration of a model.
3.B How Long?
One of the more surprising aspects of this year's event was to find out that many of the teams assumed that a person will graduate from college in four years. Roughly 55% of all students finish college in four years. This rate is lower for students in engineering fields due to the rigidity of the curriculum and the difficulty of some of the courses.
A small number of teams recognized this important aspect of the cost of college. Teams that acknowledged this demonstrated a broader understanding of the problem and a greater awareness of one of the most important factors in calculating the total cost of college.
3.C Cost of living
Finally, we make a brief note about calculating the cost of living. The vast majority of teams discussed the cost of tuition as well as room and board. A number of other teams also included the cost of books.
A relatively small number of teams recognized the importance of other costs. Those pizzas are not delivered for free! A large number of teams constructed complicated models to approximate the cost of attending a college, but a surprisingly small number of teams used cost of living adjustments as a way to compare institutions in different locations.
4 What is a Model?
One of the interesting aspects of the questions in this year's event is that the models can be expressed in a wide variety of ways. The models that were developed were described with respect to functions derived from regression, tables, and flow charts. Each of these approaches is discussed below. The final topic discussed in this section is the role of integration versus summation as a way to approximate the debt accumulated while a person attends college.
4.A Regression
The majority of teams calculated the EFC using a function. A function can be expressed in a wide variety of ways, but most teams opted for a closed form, explicit formula. The most widely used method to develop a function as a formula was to use regression.
The use of regression can be problematic. There has been improvement over the years in the way that teams use regression. This year was roughly on par with the approaches used last year. There is still room for improvement, but it is heartening to see that teams are paying close attention to this topic.
The majority of teams that used regression constructed their function from well known web-based calculators. The teams tended to use interpolation as opposed to extrapolation to calculate their results, which is appropriate. Many teams used relatively simple functions such as linear functions or quadratics. A smaller number of teams used high order polynomials with little justification for the use of such functions. Regression on high order polynomials can be problematic and should be justified based on the physical situation rather than simply making a better fit to the data.
One interesting thing that occurred this year, though, is that a few teams went beyond simply calculating the coefficients for a polynomial using regression. A small number of teams examined the residuals and performed an analysis on the regression that went beyond simply looking at the relevant plots. It makes a strong, positive statement about a team's thoughtfulness when they use regression appropriately and then examine the errors both numerically and graphically.
4.B Expressing a Function Using a Table
Another way to express a function is to use a table. Tables are a perfectly valid way to express a model. There are a number of on-line calculators that are available to calculate the EFC, and many teams made use of such calculators.
A large number of teams presented their results as a table, which is entirely appropriate. If a team does present their results as a table, though, they should carefully document the way in which they made their calculations. They also need to make sure to describe the table and let the reader know the important aspects of the table. A team should not simply have a table in their report and assume that the reader will understand what it means and how to interpret it.
4.C Flow Charts
A number of teams constructed complicated models that required a number of decisions to be made before making a calculation. Some of the teams simply referred to a computer program, but this is not a good way to discuss a model. Most readers will not read computer code to try to understand a model.
A number of teams presented their model as a flow chart. This is an excellent way to present a model and to visually demonstrate the relationships between the different parts of a model. A flow chart can make it much easier to understand a model that is composed of a complicated set of decisions.
4.D Integration vs. Summation
Another recurring question that arises each year is whether to use an integral or to use a sum in a model. For example in this year's event, students were required to estimate the debt that accumulates while a student attends a college. A number of teams used an integral to represent the accumulation of debt.
Over a long time span this can be an appropriate approximation, but for a relatively short time period a sum is a better approximation. The difference between a sum and an integral is more nuanced with respect to paying off the loans over a long period of time. Many teams used an integral even though a discrete sum more closely mimics the actual situation.
It is likely that an integral will provide a reasonable approximation in this case. It is not obvious, however, and the judges' views on how appropriate an integral is in this case are not unanimous. Paying off a loan is a discrete process, and if a team wishes to approximate the process as an integral then, at the very least, they should recognize that an integral is an approximation and is not the most accurate way to proceed.
5 On The Whole
This year's event centered on questions about the cost of college, the benefits of obtaining a degree in a STEM field, and how to make the decision to go to college. In this section, a broad overview of some of the issues that occurred because of the difficulty of the problem is given. First, the issue of answering all three questions is discussed. Next, a few notes about assumptions and justifications are given. Finally, a brief note about the letter and the conclusions is given.
The first question turned out to require a large amount of time for many teams even though this was thought to be a relatively simple question. Unlike previous M3 Challenges, I did not read any paper that provided a complete answer to all three questions. It appeared that the student teams either did not have enough time to explore all three questions, or misallocated their time.
This led to some difficulties in trying to compare the teams' entries. The judges balanced the comparison of the different parts of the Problem and provided a fair comparison based on what the teams were able to accomplish. They gave a slightly larger weight to the first question, and the second and third questions were given equal weights. The teams whose entries received the highest rankings were those that provided a strong discussion on the first problem, a strong discussion on one of the other two questions, and then provided strong insights into how to address the remaining question.
One of the other surprises in this year's event is that a large number of teams did not define basic terms and did not provide a detailed list of assumptions and justifications. Most teams provided a short list, but these lists were often incomplete and did not include details about definitions of common terms.
When writing a report, the student teams should not assume that the reader is familiar with the problem. The use of jargon should be avoided, and technical terms should be defined and described. In this year's event many teams made use of terms such as Expected Family Contribution and Total Cost of Attendance without describing the terms. Part of the problem with this is that some teams did not understand these terms in the same way that many judges understood them based on their preparations for the event. This led to a good deal of confusion since judges often had to try to figure out how a team was using certain terms as compared to their own understanding of the term.
Another issue in this year's event was that the students were asked to write a letter to administrators to introduce their approach to the problem. This turned out to be a surprisingly difficult task. The vast majority of teams simply wrote the letter and used it for their summary. The summary should include at least three things: it should introduce the problem and provide a context to the problem; it should convey an idea of the modeling approaches used; and it should give specific results. Ideally, the summary should be given in a way that provides an outline for the order of topics in the report.
The vast majority of teams did a superb job of providing the context, and many teams also did a good job of conveying an idea about how they approached their modeling efforts. Very few teams, however, included specific results. The few teams that did immediately stood out.
Finally, there was one difference from last year's event that represents a significant improvement. In last year's event a large number of teams omitted a final section with their conclusions. It makes for a rather jarring ending to a report without a few paragraphs to tie together the different aspects of the team's work. In this year's event a large percentage of the papers did include a conclusion section, and the quality of the papers was greatly improved by this one simple addition.
6 Conclusions
The questions included in this year's Challenge focused on the cost of obtaining a degree in a Science, Technology, Engineering, or Mathematics (STEM) field. The questions required that the student teams determine the total cost of obtaining a degree and the long-term benefits. Teams were also asked to construct a rubric for helping individuals make a choice about whether or not they should obtain a college degree and if so which degree to first explore. The questions represented a difficult challenge, and no one team provided a complete model and analysis for all three questions.
The open nature of the questions required that the students stay focused on the basic principles of modeling. Students needed to be careful about how they presented their models and make sure that the models were consistent with respect to units and their assumptions. Basic practices associated with citations and references were also important to observe. Finally, the time constraints made it difficult for teams to convey a sense of the iterative process of constructing and refining a model.
Despite the difficulties, most teams were able to create models for at least the first question and were able to make good progress on at least one of the other questions. The first question was interpreted to be a much more difficult question than was intended. The teams made use of a wide variety of approaches to the question and provided extensive insight into their approach.
An additional consideration is that the models represented a combination of factors with respect to cost and comparing monetary values in the present with values in the future. To complicate matters, the third question required the construction of a complex rubric that did not easily follow more traditional mathematical models. Expressing the results of the model was a difficult task with teams using a variety of methods, including mathematical formulas, tables, and flow charts.
Another issue that arose is that the topic had a large number of well defined terms. These terms were not interpreted the same way by all of the teams. Teams that made use of the terms and formally defined them were at an advantage with respect to ensuring that their work was more likely to be interpreted correctly by the person reading their report.
Finally, we are once again grateful and continue to be impressed by the hard work of the teams and their coaches. We continue to see improvements in the student entries each year, and we are grateful for the immense effort the students and coaches put into this event. Their practice and work prior to the event has resulted in huge dividends. Thank you all!
Acknowledgements
This document has benefited greatly from the insights and editorial feedback from Kathleen LeBlanc and Michelle Montgomery. Thank you for your help and taking the time to read over this document. I am grateful for your insights and help.