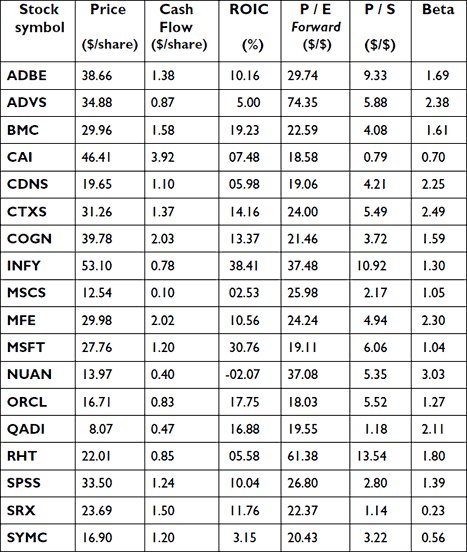
Your team has been appointed portfolio manager with $30,000 to invest. Assume that the market will be generally rising. You have been directed to purchase any combination of up to six stocks from among the 18 listed on the following page, and sell them after one year. Your goal is to maximize the net profit from these sales. Develop a method to select your choice of stocks, and justify this selection.
Investors have sometimes used the four indicators of stock quality and one indicator of risk or volatility (Beta) given below to influence their choice of investments.
List your stock picks and amounts invested. Justify your stock portfolio.
Recent results suggest that a relatively high ROIC and relatively low (but not too low) P/E are strong indicators of the value of a stock. If this information leads to changes in your picks or the amounts invested, list your new portfolio; if your portfolio did not change, explain why.
If you are convinced there is a better measure of performance, use it to replace one of the five indicators, justify your decision, and list your new portfolio.
Suggest a way to test or validate your model(s).
Free Cash Flow – (Cash Flow) / (Number of shares of stock). This is the cash per share not needed for operations or re-investment, and is a measure of a company’s financial strength. A company will not stay in business for long if it has a small or negative cash flow.
ROIC, Return on Invested Capital – (Net income) / (Invested capital). A high ROIC indicates a quality or strong company.
P/E ratio, Price to Earnings ratio – (Price per share of stock) / (Earnings per share of stock).This old stand-by is used as a measure of how expensive a stock is. For example, if a corporation stock is currently selling for $36 a share and over the last year the corporation earned $1.50 per share, the P/E = 36/1.50 = 24. A high P/E is a sign that the stock might be too expensive.
P/S ratio, Price to Sales ratio – (Price per share of stock) / (Revenue per share of stock) Useful for tech companies since it reflects the contribution of an important intangible, intellectual property. Generally, the lower this ratio, the more attractive the investment.
Beta, β – This indicator is a measure of the risk or volatility of a stock. β =1 indicates that the price of the stock moved with the overall market. β >1 indicates that the stock price moved more then the overall market; and β <1 indicates that the stock price moved less then the overall market.
The five indicators are defined and discussed on several sites. For example, http://www.investopedia.com/ and http://en.wikipedia.org/wiki/Investment.
You may use only public (free) Web sites to search for information on stocks.
Eighteen Computer Software/Services Corporation Stocks

This is the same data that is provided above, however it is being offered as a separate download if you choose to work with it in either MS Word or MS Excel. For your convenience, you may download the data portion of the 2007 Moody’s Mega Math Challenge problem in two different formats: MS Word and MS Excel
The data are from the site http://www.smartmoney.com. These are the closing figures for Friday, March 2, 2007. You can find this information by choosing “Key Statistics” from the pull-down menu under “Search” and entering the stock symbol on the next line.
Reference and other links included on this page were current and valid at time of original posting; if they are no longer valid or live please look for similar or updated links in context with the referenced topic.


