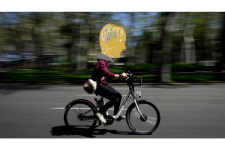
Though electric automobiles have been a hot-ticket item in recent years1 they were not the most in-demand electric vehicle on the market. That distinction went to the electric bicycle, a.k.a. the e-bike2. The Light Electric Vehicle Association estimates that the United States saw a 70% increase in annual e-bike sales in 20213. While this increase may not be uniform (for example, bikes tend to be more popular in urban areas), in many cases, e-bikes provide people with a fast, reliable transportation option that comes without the worry of timing public transit, the nuisance of parking, or the stress of traffic congestion4,5. E-bikes have also revolutionized some businesses that rely on them for delivery of food and other goods5. And in some countries where car ownership is rare, electric bikes are an affordable transportation option.
Policy makers are observing these changes with interest and wondering if e-bikes are likely to become part of a more sustainable energy plan by getting more cars off the roads. Some are even considering tax incentives for people who use e-bikes, and/or investing in more bike lanes5,6,7.
Before getting to these bigger, policy-related questions, policy makers are interested in the answers to the following foundational questions. Answer each of the following for either the U.S. or the UK (or both if you have time).
- Q1: The Road Ahead—Create a model to predict growth in e-bike sales. Predict the number of e-bikes that will be sold two and five years from now.
- Q2: Shifting Gears—In addition to being able to predict growth, it is often important to understand the underlying causes of that growth. For e-bikes, there is a lot of debate about what exactly led to the increase in their usage and/or sales. Some commonly cited reasons include: environmental awareness, gas prices, personal finances, health and exercise, and the “coolness factor” (increased visibility of others with e-bikes increases demand). Consider one or more factors that may have contributed to e-bike growth and use mathematical modeling to argue whether that factor (or factors) was a significant reason for the growth of e-bike usage.
- Q3: Off the Chain—As more people choose e-bikes as their preferred mode of transportation, there may be reduced usage of other modes of transportation, like gas vehicles and regular bikes. Quantify the resulting impacts on carbon emissions, traffic congestion, health and wellness, and/or other factors you deem important.
Your submission should include a one-page executive summary with your findings, written in the form of a brief to the head of the UK Department of Transport and/or the U.S. Department of Transportation, followed by your solution paper—for a maximum of 20 pages. Remember to cite your sources, including those in the provided data files if you use them. If you choose to write code as part of your work to be eligible for the technical computing prize, please include it as an appendix and check the box on the upload page. Any code appendix or reference page(s) will not count toward your 20-page limit.
Data Statement
Various organizations and agencies collect all kinds of data that may be relevant to this problem. A small amount of data has been compiled and a link to an Excel spreadsheet with three worksheets of data is provided and summarized below. You are not required to use this data; that is, you may choose to use none, some, or all of this data and/or any additional data sources you may identify while working on this problem. Data sets in the real world are often incomplete or contain holes. Be sure to cite all resources used.
The following three data worksheets are in a spreadsheet found here with tabs marked accordingly:
Q1 E-bike Sales
Q2 Contributing Factors
Q3 Modes of Transportation
If you use this data, please cite it as follows:
Ride Like the Wind, MathWorks Math Modeling Challenge 2023, https://m3challenge.siam.org/wp-content/uploads/TCP23_data.xlsx.
MATLAB Users:
If you are trying to use Excel or any other spreadsheet data in MATLAB, you can import the data by double-clicking the files in MATLAB’s “Current Folder” browser or use the Import Data Button (https://www.mathworks.com/help/matlab/spreadsheets.html?ue) at the top of the Toolstrip.
Watch this quick MATLAB video tutorial (https://www.youtube.com/watch?v=0hArv-UBKQQ&list=PLn8PRpmsu08oBSjfGe8WIMN-2_rwWFSgr&index=14) about importing spreadsheet data.
- https://www.iea.org/data-and-statistics/data-product/global-ev-outlook-2022 (International Energy Agency)
- https://electrek.co/2022/01/26/electric-bicycles-are-now-outselling-electric-cars-and-plug-in-hybrids-combined-in-the-us/ (Electrek)
- https://electrek.co/2022/07/03/electric-bikes-most-popular-attractive-study/ (Electrek)
- https://www.ebicycles.com/ebike-facts-statistics/ (eBicycles)
- https://www2.deloitte.com/us/en/insights/industry/technology/smart-micromobility-e-bikes.html (Deloitte)
- https://www.wired.co.uk/article/cargo-bikes-greener-quicker (Wired)
- https://www.axios.com/local/austin/2023/01/13/e-bike-popularity-austin-energy-rebates (AXIOS Austin)
Problem authors: Dr. Neil Nicholson, University of Notre Dame, and Dr. Chris Musco, New York University, with input from M3 Challenge Problem Development Committee members. We would like to extend a special thank you to Mark Leith, NetZero Consultant to the Australian Government, and Ian Swain, Energy Advisor in Perth, Australia, whose expertise and insight were valuable in forming the questions.
Reference and other links included on this page were current and valid at time of original posting; if they are no longer valid or live please look for similar or updated links in context with the referenced topic.


